SaaS analytics
Subscription Intelligence Dashboard
Revenue analytics for small subscription businesses where every number traces to its events — and the AI insights layer deliberately didn't make the cut.
The experiment
Every analytics product in 2026 ships an AI insights layer. This experiment argues the opposite position and tries to falsify it: for a small subscription business, correct, explainable arithmetic is the product, and a generated “insight” is at best decoration and at worst a liability. The hypothesis: a founder will trust and act on a dashboard where every number can be opened down to the billing events that produced it — and will quietly stop trusting one that editorializes.
That makes this a why-no-AI flagship on purpose. HummingByte builds AI products; the discipline of knowing when not to is part of the same craft.
Who it serves
- Founders of small SaaS and subscription businesses, roughly the first employee to the first twenty
- Indie developers running app subscriptions who currently reconcile Stripe exports in spreadsheets
- Fractional CFOs and advisors who need numbers they can defend in a board email
The problem with subscription numbers
Ask three tools for a company’s MRR and you get three answers. Proration, currency, trials, pauses, refunds, annual-prepay smoothing, and grandfathered plans all admit multiple defensible treatments — and most dashboards pick one silently. The result is a familiar failure: the founder sees a churn spike, panics, spends an evening in raw Stripe data, discovers it was a currency wobble plus one annual invoice, and never quite trusts the dashboard again. The product problem is not analysis. It is auditability.
Product strategy
- One metrics dictionary, in writing. Every metric has a published definition — how proration, trials, pauses, and refunds are treated — visible in the interface, versioned when it changes. Disagreement with another tool should be explainable in one sentence.
- Every number is a door. Any figure on any screen opens into the movements that compose it, and any movement opens into the raw billing events behind it. No dead-end numbers, anywhere.
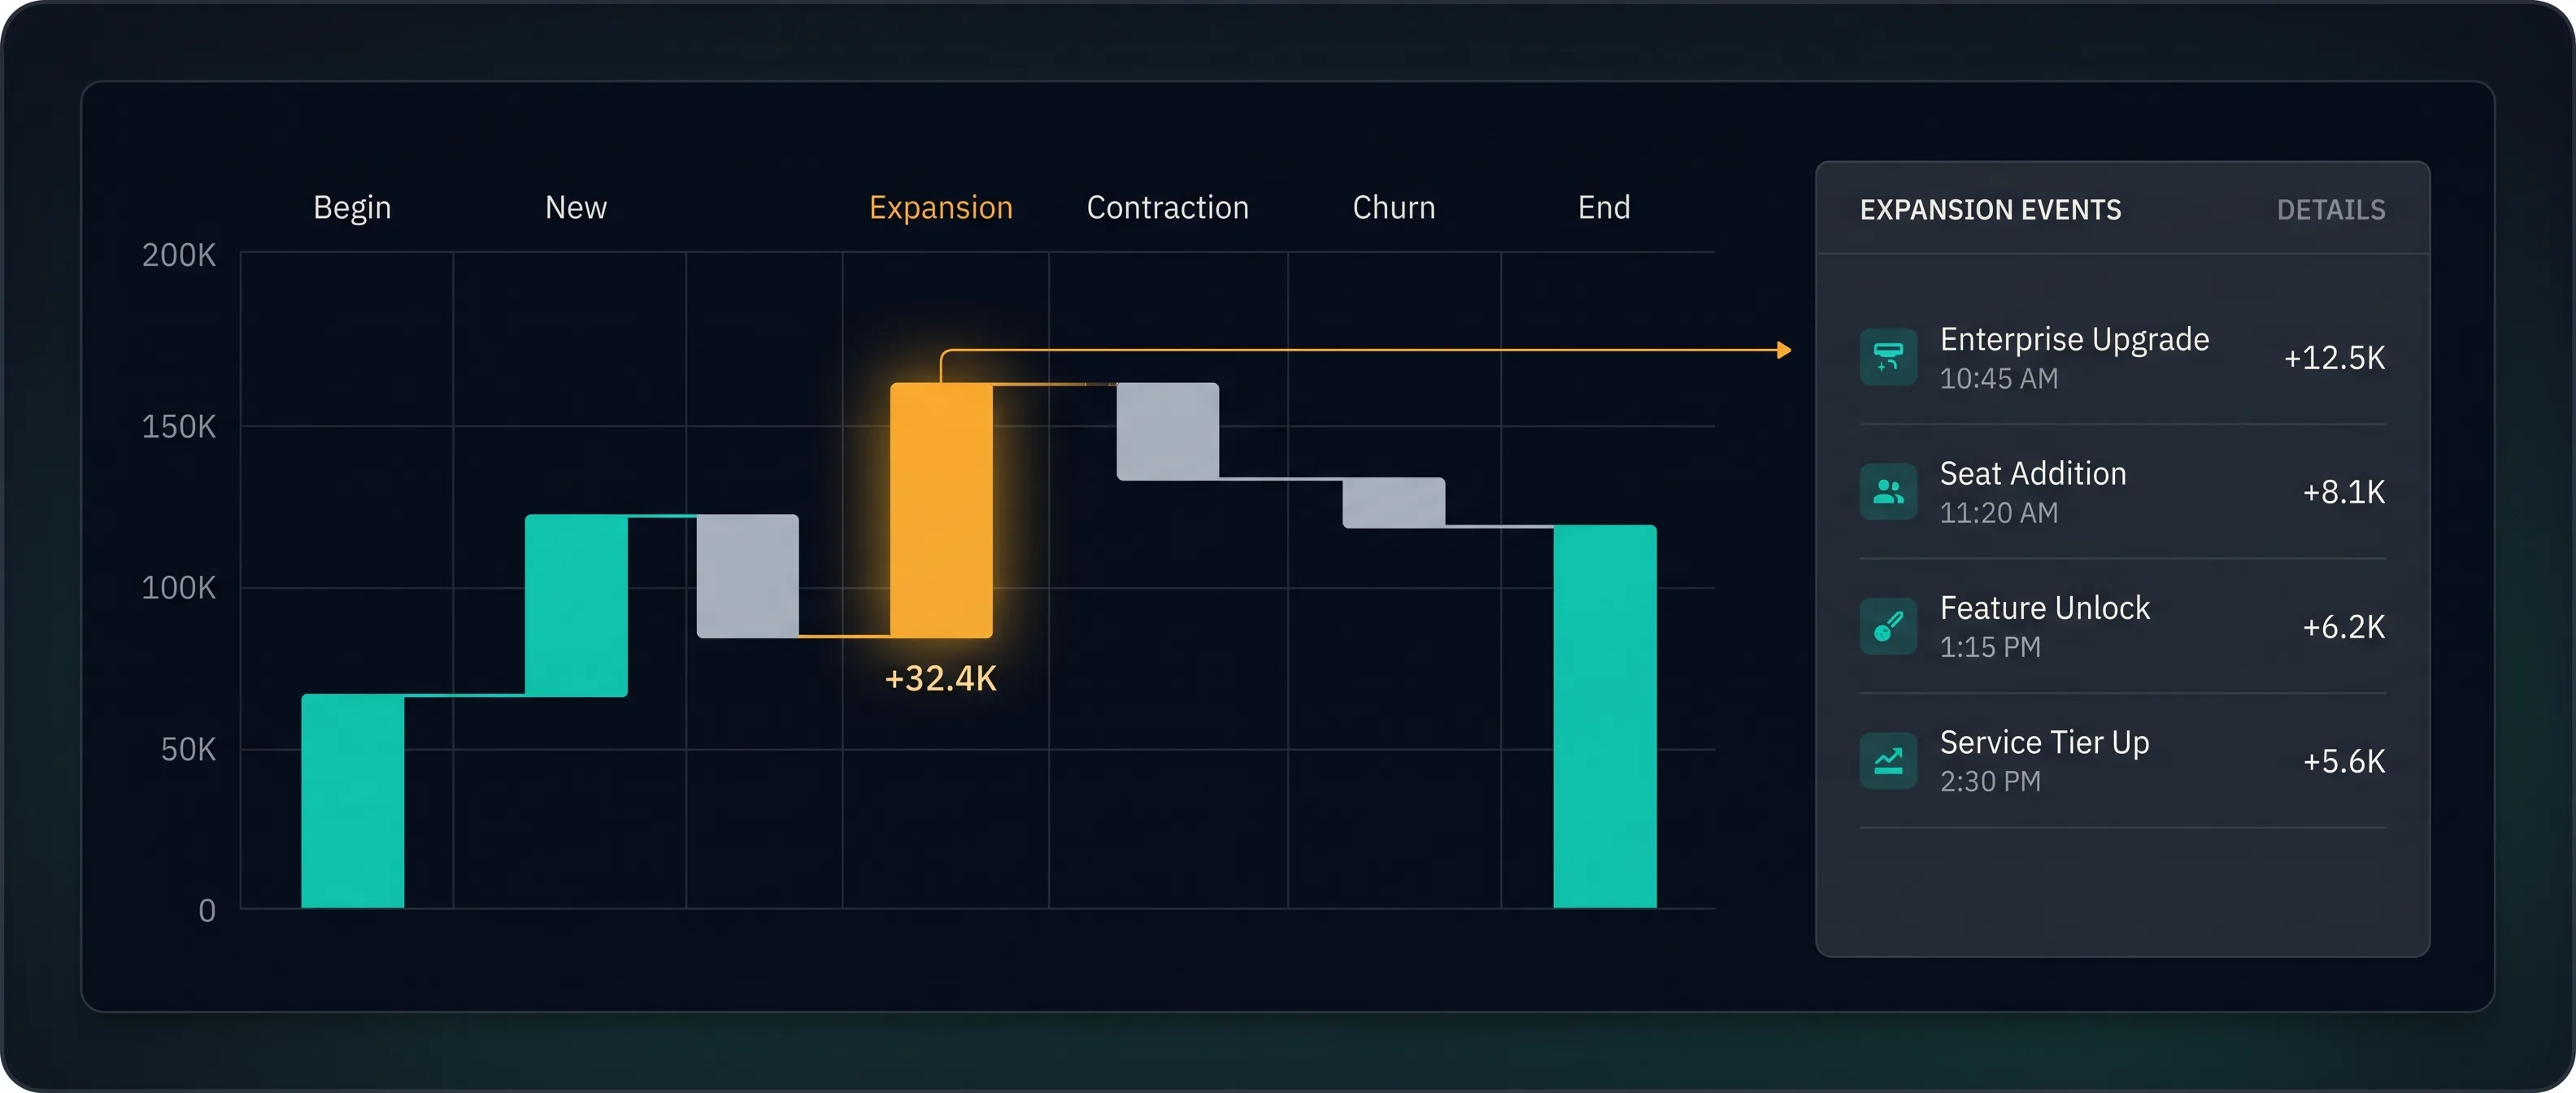
- Decomposition over commentary. The dashboard’s job is to split a change into its parts — new, expansion, contraction, churn, currency, timing — not to explain why the parts happened. The founder knows the why; they were there.
- Deterministic by construction. Recomputing any historical number from the event log yields the identical answer. If a definition changes, history is restated visibly, with both versions available.
From headline to event
- Headline net MRR down this month
- Movement split new / expansion / contraction / churn / FX
- Churn decomposition voluntary vs. payment failure, by plan
- Customer list the actual accounts, with tenure and plan
- Billing events the raw records — end of the trail
- Founder judgment act, or correctly do nothing
Five clicks from headline to raw record is the structural promise. The last step is deliberately human and deliberately includes “do nothing” — a large share of metric movements deserve exactly that response, and a tool that manufactures urgency out of noise trains its user to ignore it.
Major surfaces
- MRR movements: waterfall of new, expansion, contraction, churn, and reactivation, with currency and timing effects separated out rather than smeared across categories
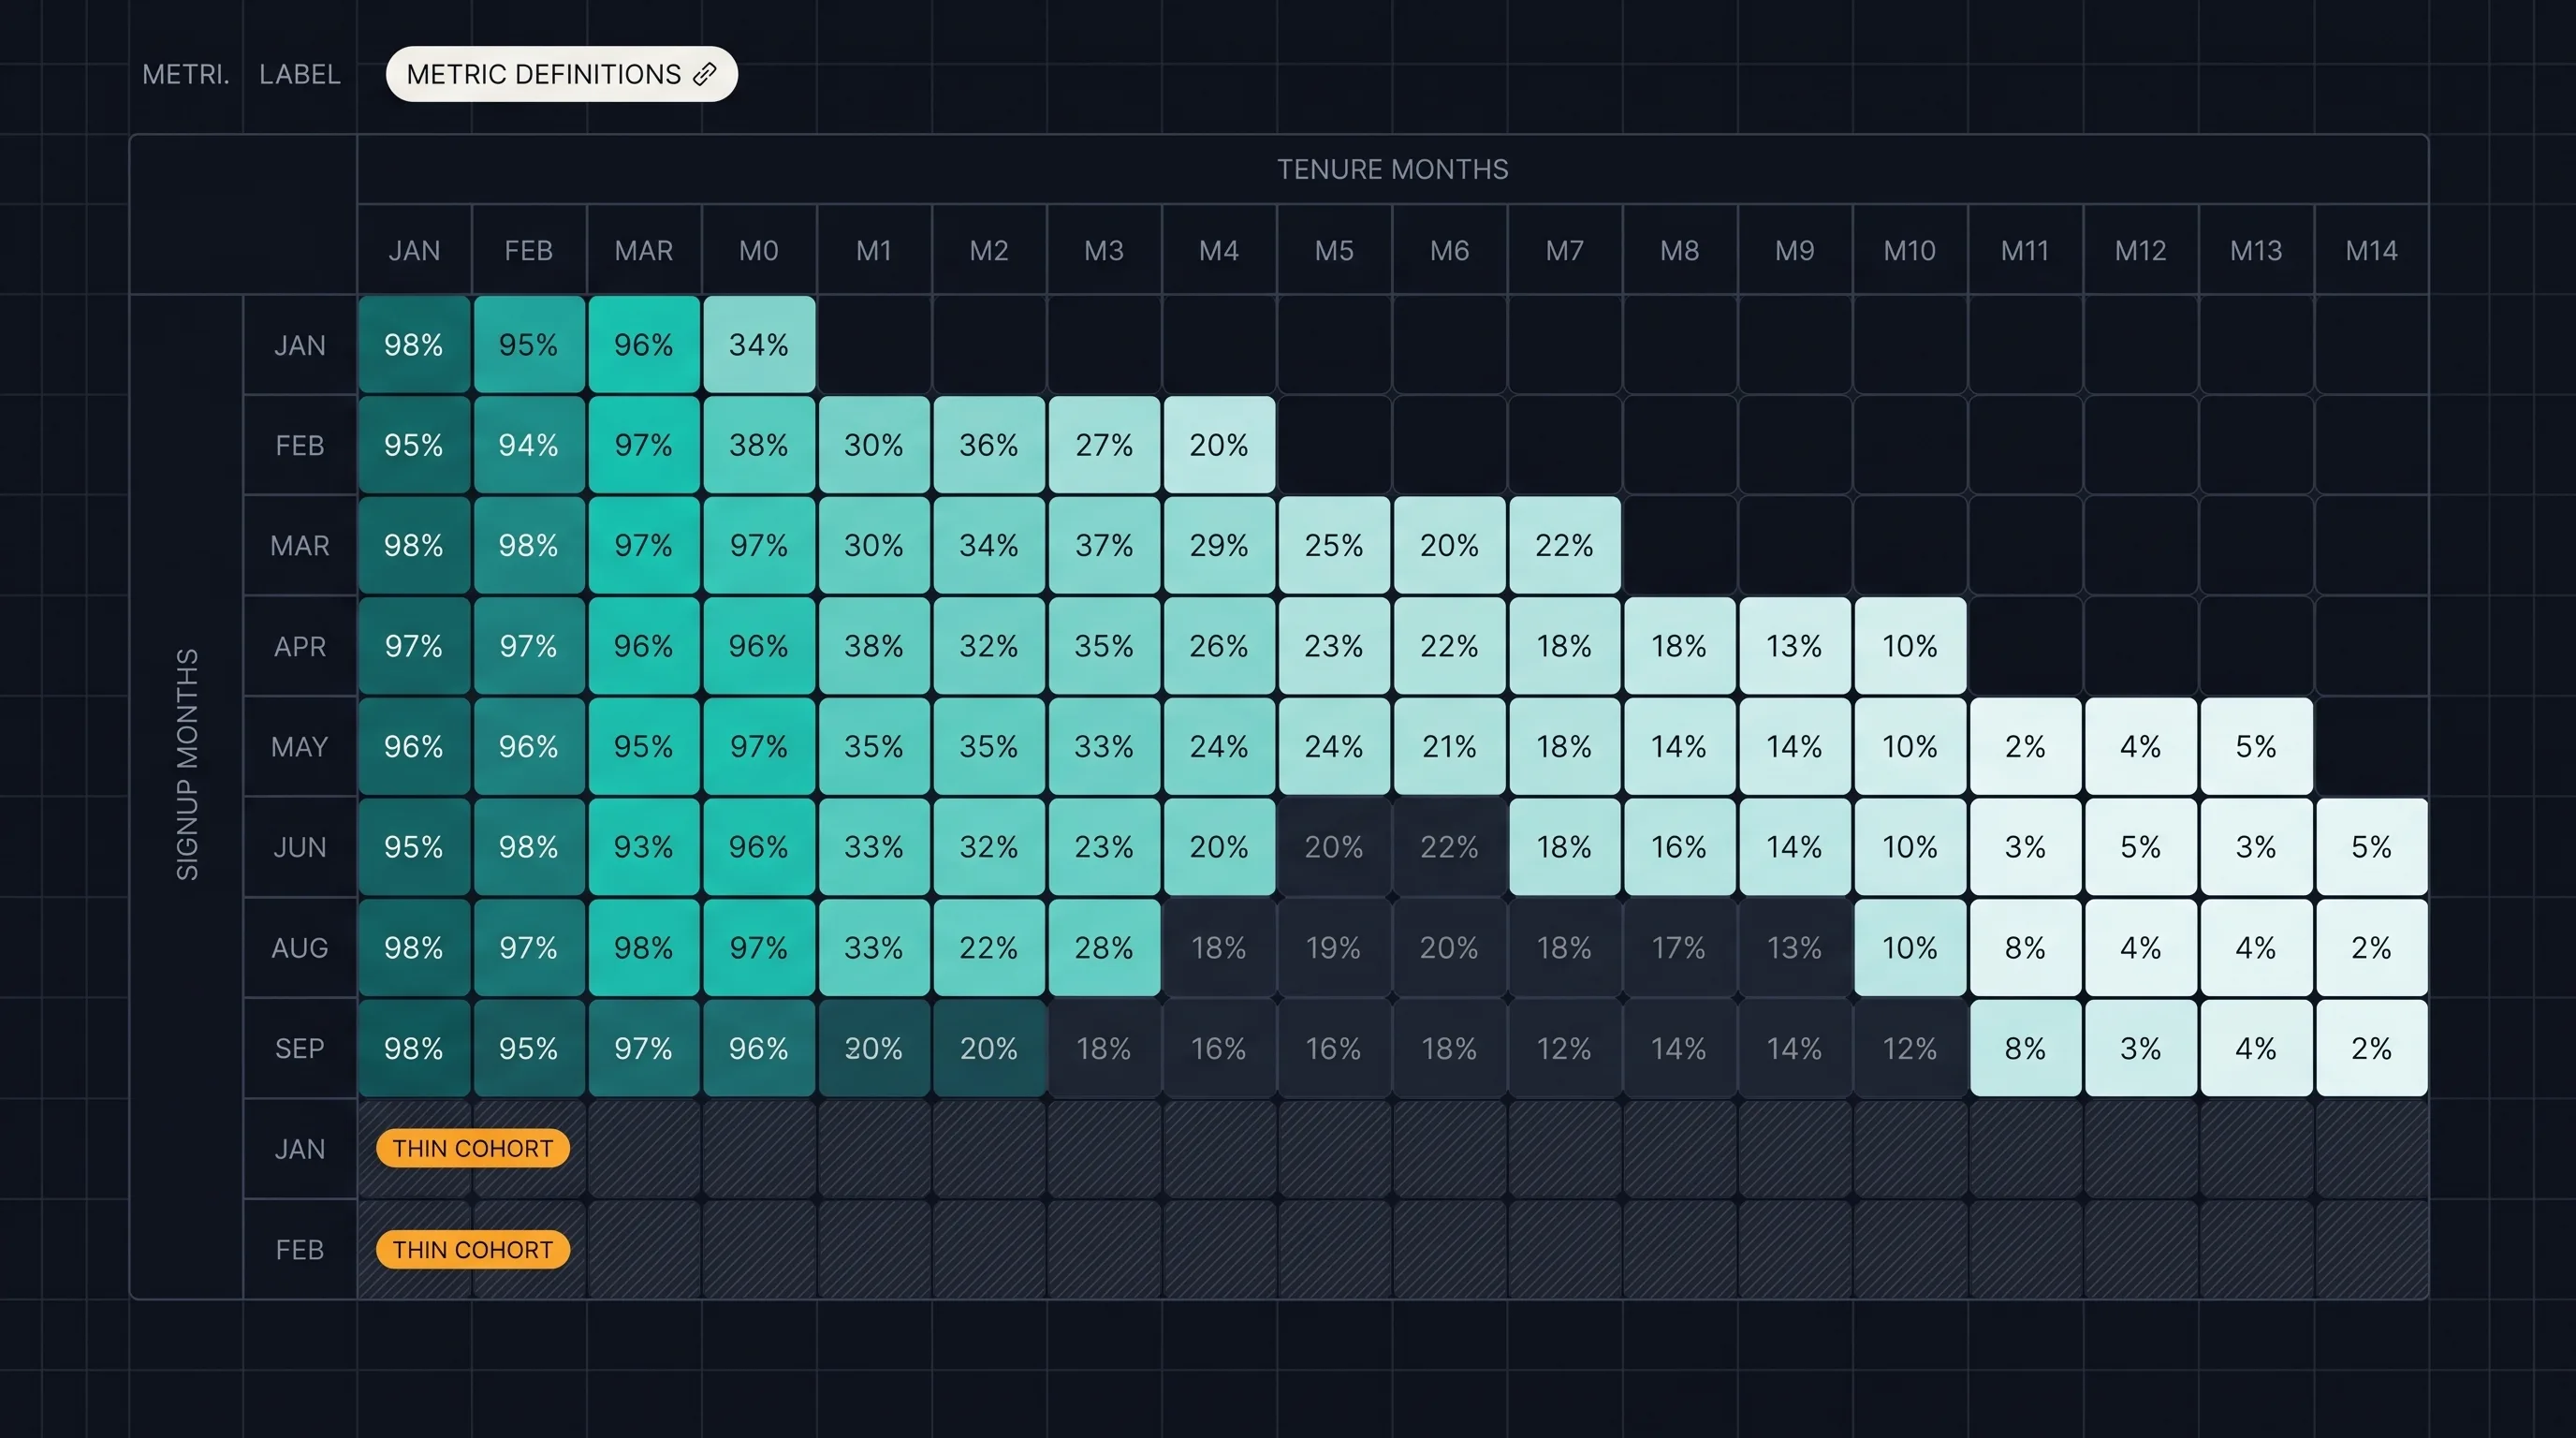
- Cohort retention: revenue and logo retention by signup month and by plan, with small-cohort cells visually marked as too thin to conclude anything from
- Churn decomposition: voluntary vs. involuntary, by plan, tenure band, and payment method — the split that decides whether the fix is product work or dunning work
- Annual-prepay lens: cash vs. recognized views side by side, because conflating them is the most common self-inflicted wound in small-SaaS finance
- Board page: one printable page of defined metrics with their definitions footnoted
The founder test
Every proposed “insight” feature was run through one rule: would a founder act on this? Not “is it interesting” — would it change a decision this week. “Churn is up 12% versus last month” fails; the founder still has to open the data to know what to do. “Payment failure churn is concentrated in cards from one region, retry schedule attached” passes — but it passes as a deterministic rule over decomposed data, not as generated prose. What survived the test was, consistently, arithmetic with a trail. What failed was narrative.
Why no AI, precisely
Three reasons, stated as engineering rather than ideology. First, the input is small, structured, and exact — billing events — where LLM summarization adds paraphrase risk to data that had none. Second, the product’s core asset is trust in numbers; one confidently wrong generated sentence spends trust that took months to earn, and small-business finance is an unforgiving place to spend it. Third, the honest uses of AI here (anomaly narration, “explain this movement”) were consistently beaten in design review by a good decomposition view that lets founders see it themselves — faster than reading a paragraph about it. The experiment keeps a door open: if a generated explanation can cite events the way every native number does, it may earn a place. It starts outside.
System overview
- Ingestion: billing-provider events (Stripe-class APIs) into an append-only event store; imports are idempotent and re-runnable
- Metrics engine: pure functions from event log to metric series; definitions are code, versioned, and rendered into the human-readable dictionary from the same source
- Trace index: precomputed links from every aggregate to its contributing events, so the click-through path is instant rather than a query that founders learn to dread
- No third-party analytics on the dashboard itself; the product should meet its own bar
Data and trust considerations
Revenue data is among the most sensitive things a small company has. The experiment’s posture: read-only API scopes, per-tenant encryption at rest, EU hosting, no training or secondary use of customer data, and an export that reproduces every metric from raw events so leaving is easy. A tool asking to be trusted with revenue should be trivially auditable and trivially escapable.
Prototype scope
One billing provider, one currency baseline with FX handling for the common cases, and the four core surfaces. Historical import over realistic synthetic datasets seeded with known answers — including deliberately ugly ones: mid-cycle upgrades, refund storms, plan migrations, and a currency swing.
Evaluation plan
- Reconciliation: metrics match hand-computed spreadsheet truth on seeded datasets, to the cent
- Trace completeness: 100% of displayed aggregates resolve to events in five clicks or fewer
- Founder sessions: given a seeded anomaly, can a founder find its cause unaided, and how fast
- Definition clarity: can a founder restate each metric’s definition after a week of use
- The absence test: do test users ask for an AI summary unprompted — and what, specifically, do they want it to say
Risks and open questions
- Market honesty: founders may say they want traceability and still buy the tool with the confident paragraph on top
- Definition politics: a published metrics dictionary invites disagreement from every accountant a customer has; that friction is partly the point, but it has a cost
- Scope creep toward general BI is the death of focus; the boundary is subscription arithmetic, not “analytics”
- Billing-provider API drift makes the ingestion layer a permanent maintenance tax
Expansion possibilities
If the trust thesis holds, adjacent arithmetic follows the same rule: revenue recognition summaries, dunning performance, and pricing-change impact views — each one a decomposition with a trail, each new number a door.