Industrial operations
Predictive Maintenance Console
Sensor-driven maintenance planning where models propose and planners decide — built to fight alert fatigue without missing the failure that matters.
The tension this concept lives in
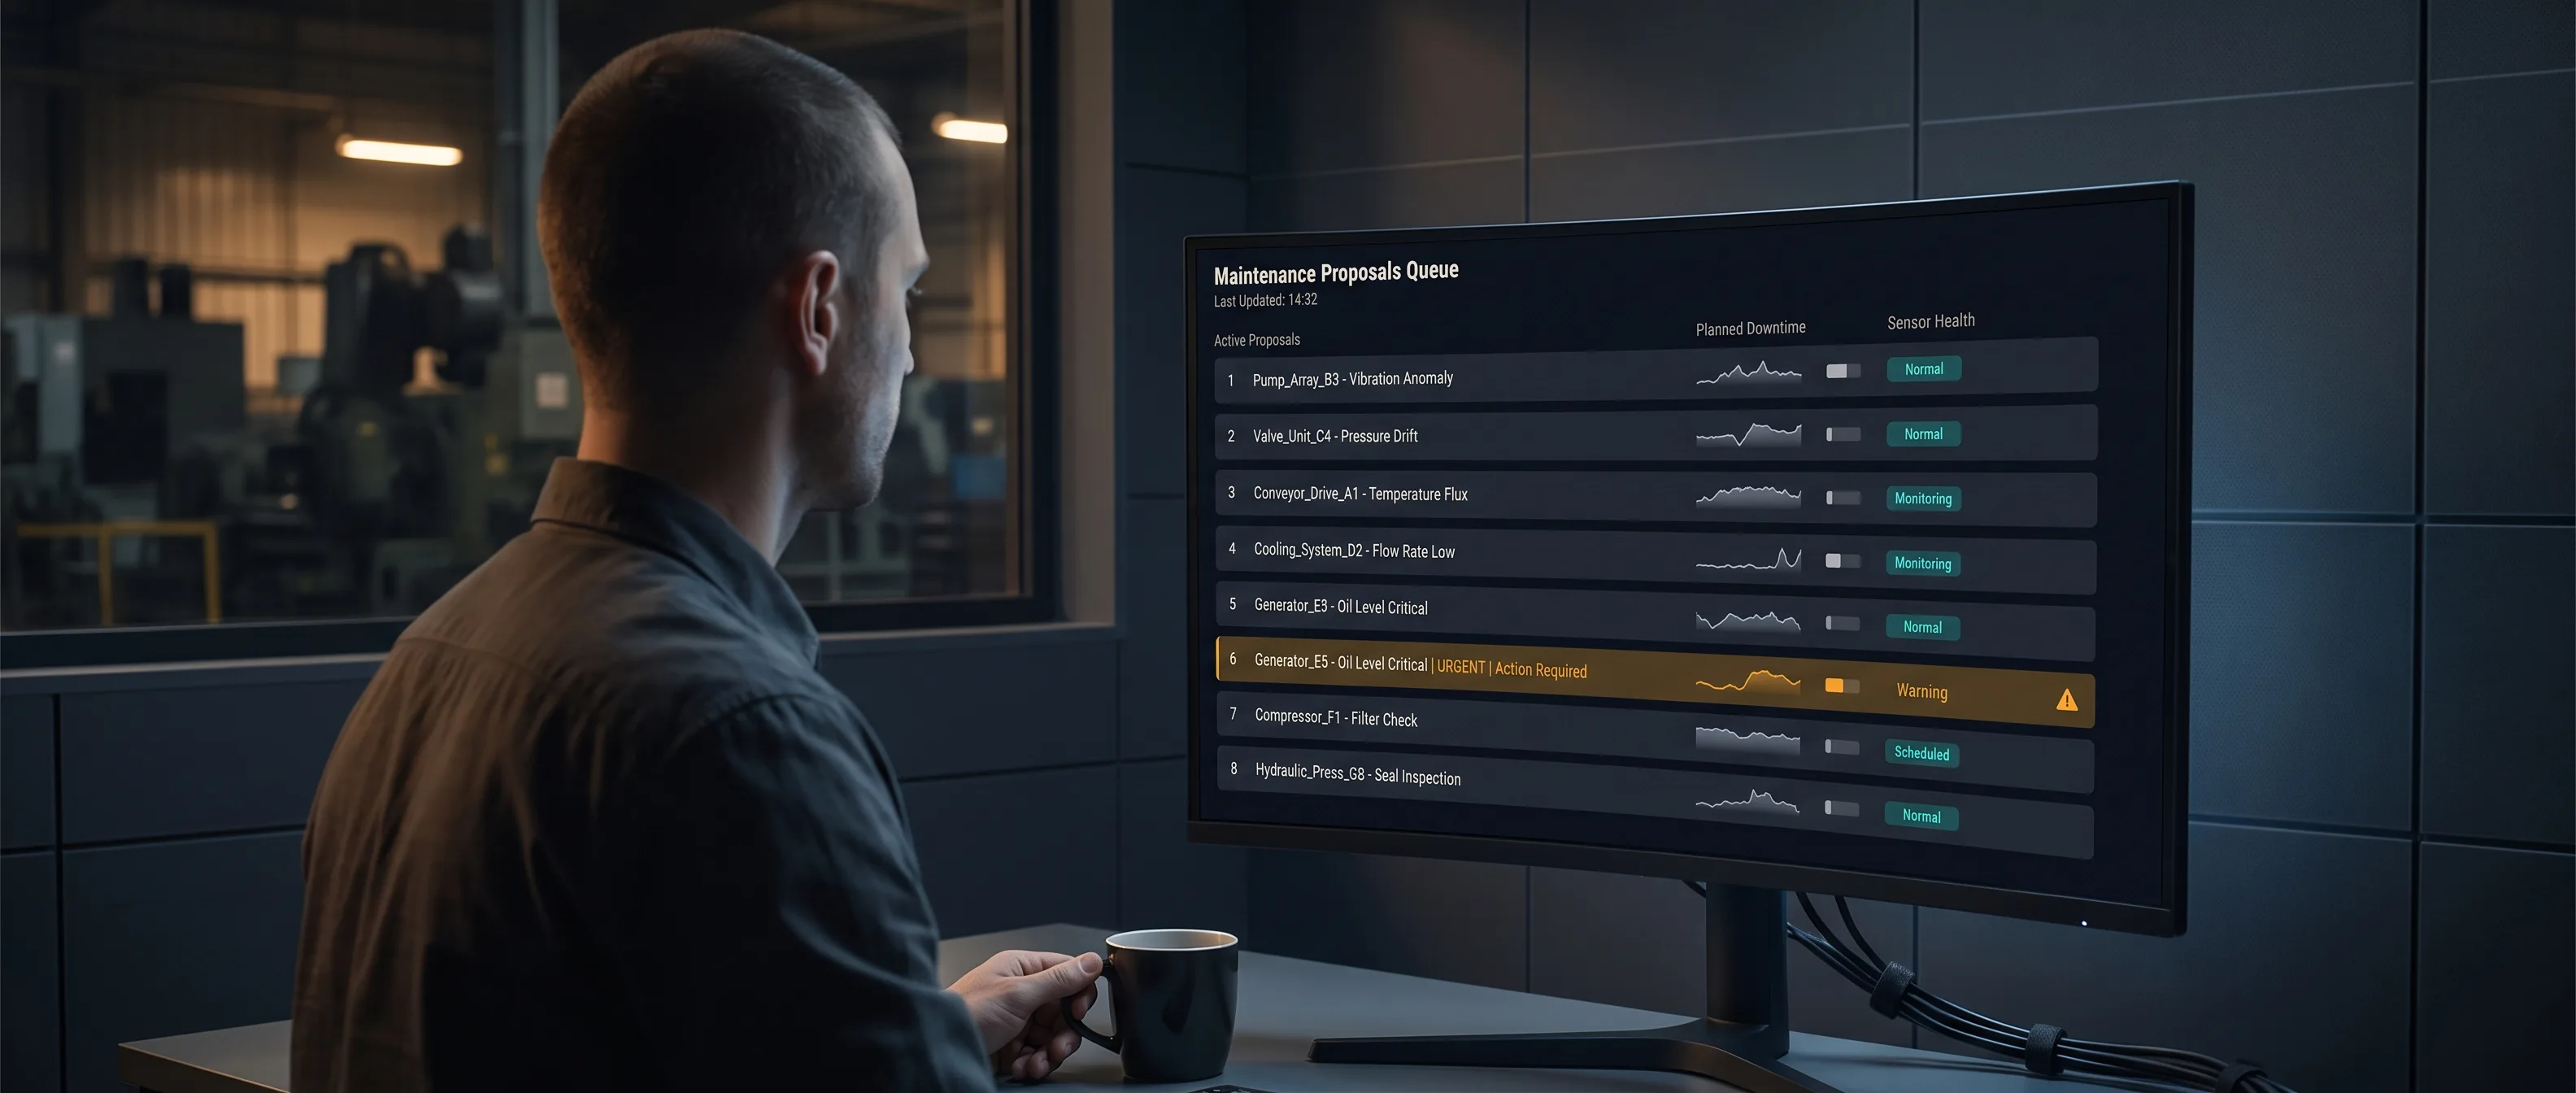
Predictive maintenance tools die one of two deaths. Either they alert too often and get muted — the maintenance team learns within weeks that the red badge means nothing — or they alert too rarely and miss the bearing failure that stops a line for two days. Every design decision in this concept is downstream of that tension: an alert is a withdrawal from a trust account, and the account is small.
Product thesis
Mid-size industrial operators — the plant with 50 to 500 monitored assets and no data science team — are underserved by predictive maintenance. Enterprise platforms assume clean historians and dedicated analysts; sensor-vendor dashboards assume the sensor is the product. The interesting product is a planning console: model output is one input into a schedule that a human maintenance planner owns, alongside production windows, parts availability, and everything else the model cannot see.
Who it serves
- Maintenance planners and supervisors at mid-size manufacturing and process sites
- Technicians executing inspections and work orders on the floor
- Operations managers accountable for downtime and maintenance spend
The data reality
The unglamorous truth first: industrial sensor data is messy. Tags are mislabeled, sensors drift out of calibration, historians have gaps, and half the maintenance history lives in a retired planner’s memory rather than the CMMS. A concept that assumes clean training data is a demo, not a product. So data quality is a first-class surface here — sensor health is monitored like asset health, gaps and drift are flagged where the planner can see them, and every model abstains visibly when its inputs fall below a quality floor, instead of guessing quietly.
Product strategy
- Models propose, planners decide. The system never schedules work, never dispatches, never shuts anything down. Its entire output is a ranked queue of proposals with evidence attached.
- Alerts are rationed. The planner sets an alert budget — how many proposals per week the team can actually investigate — and the system ranks within it, favoring precision. False alarms are counted and displayed, not buried.
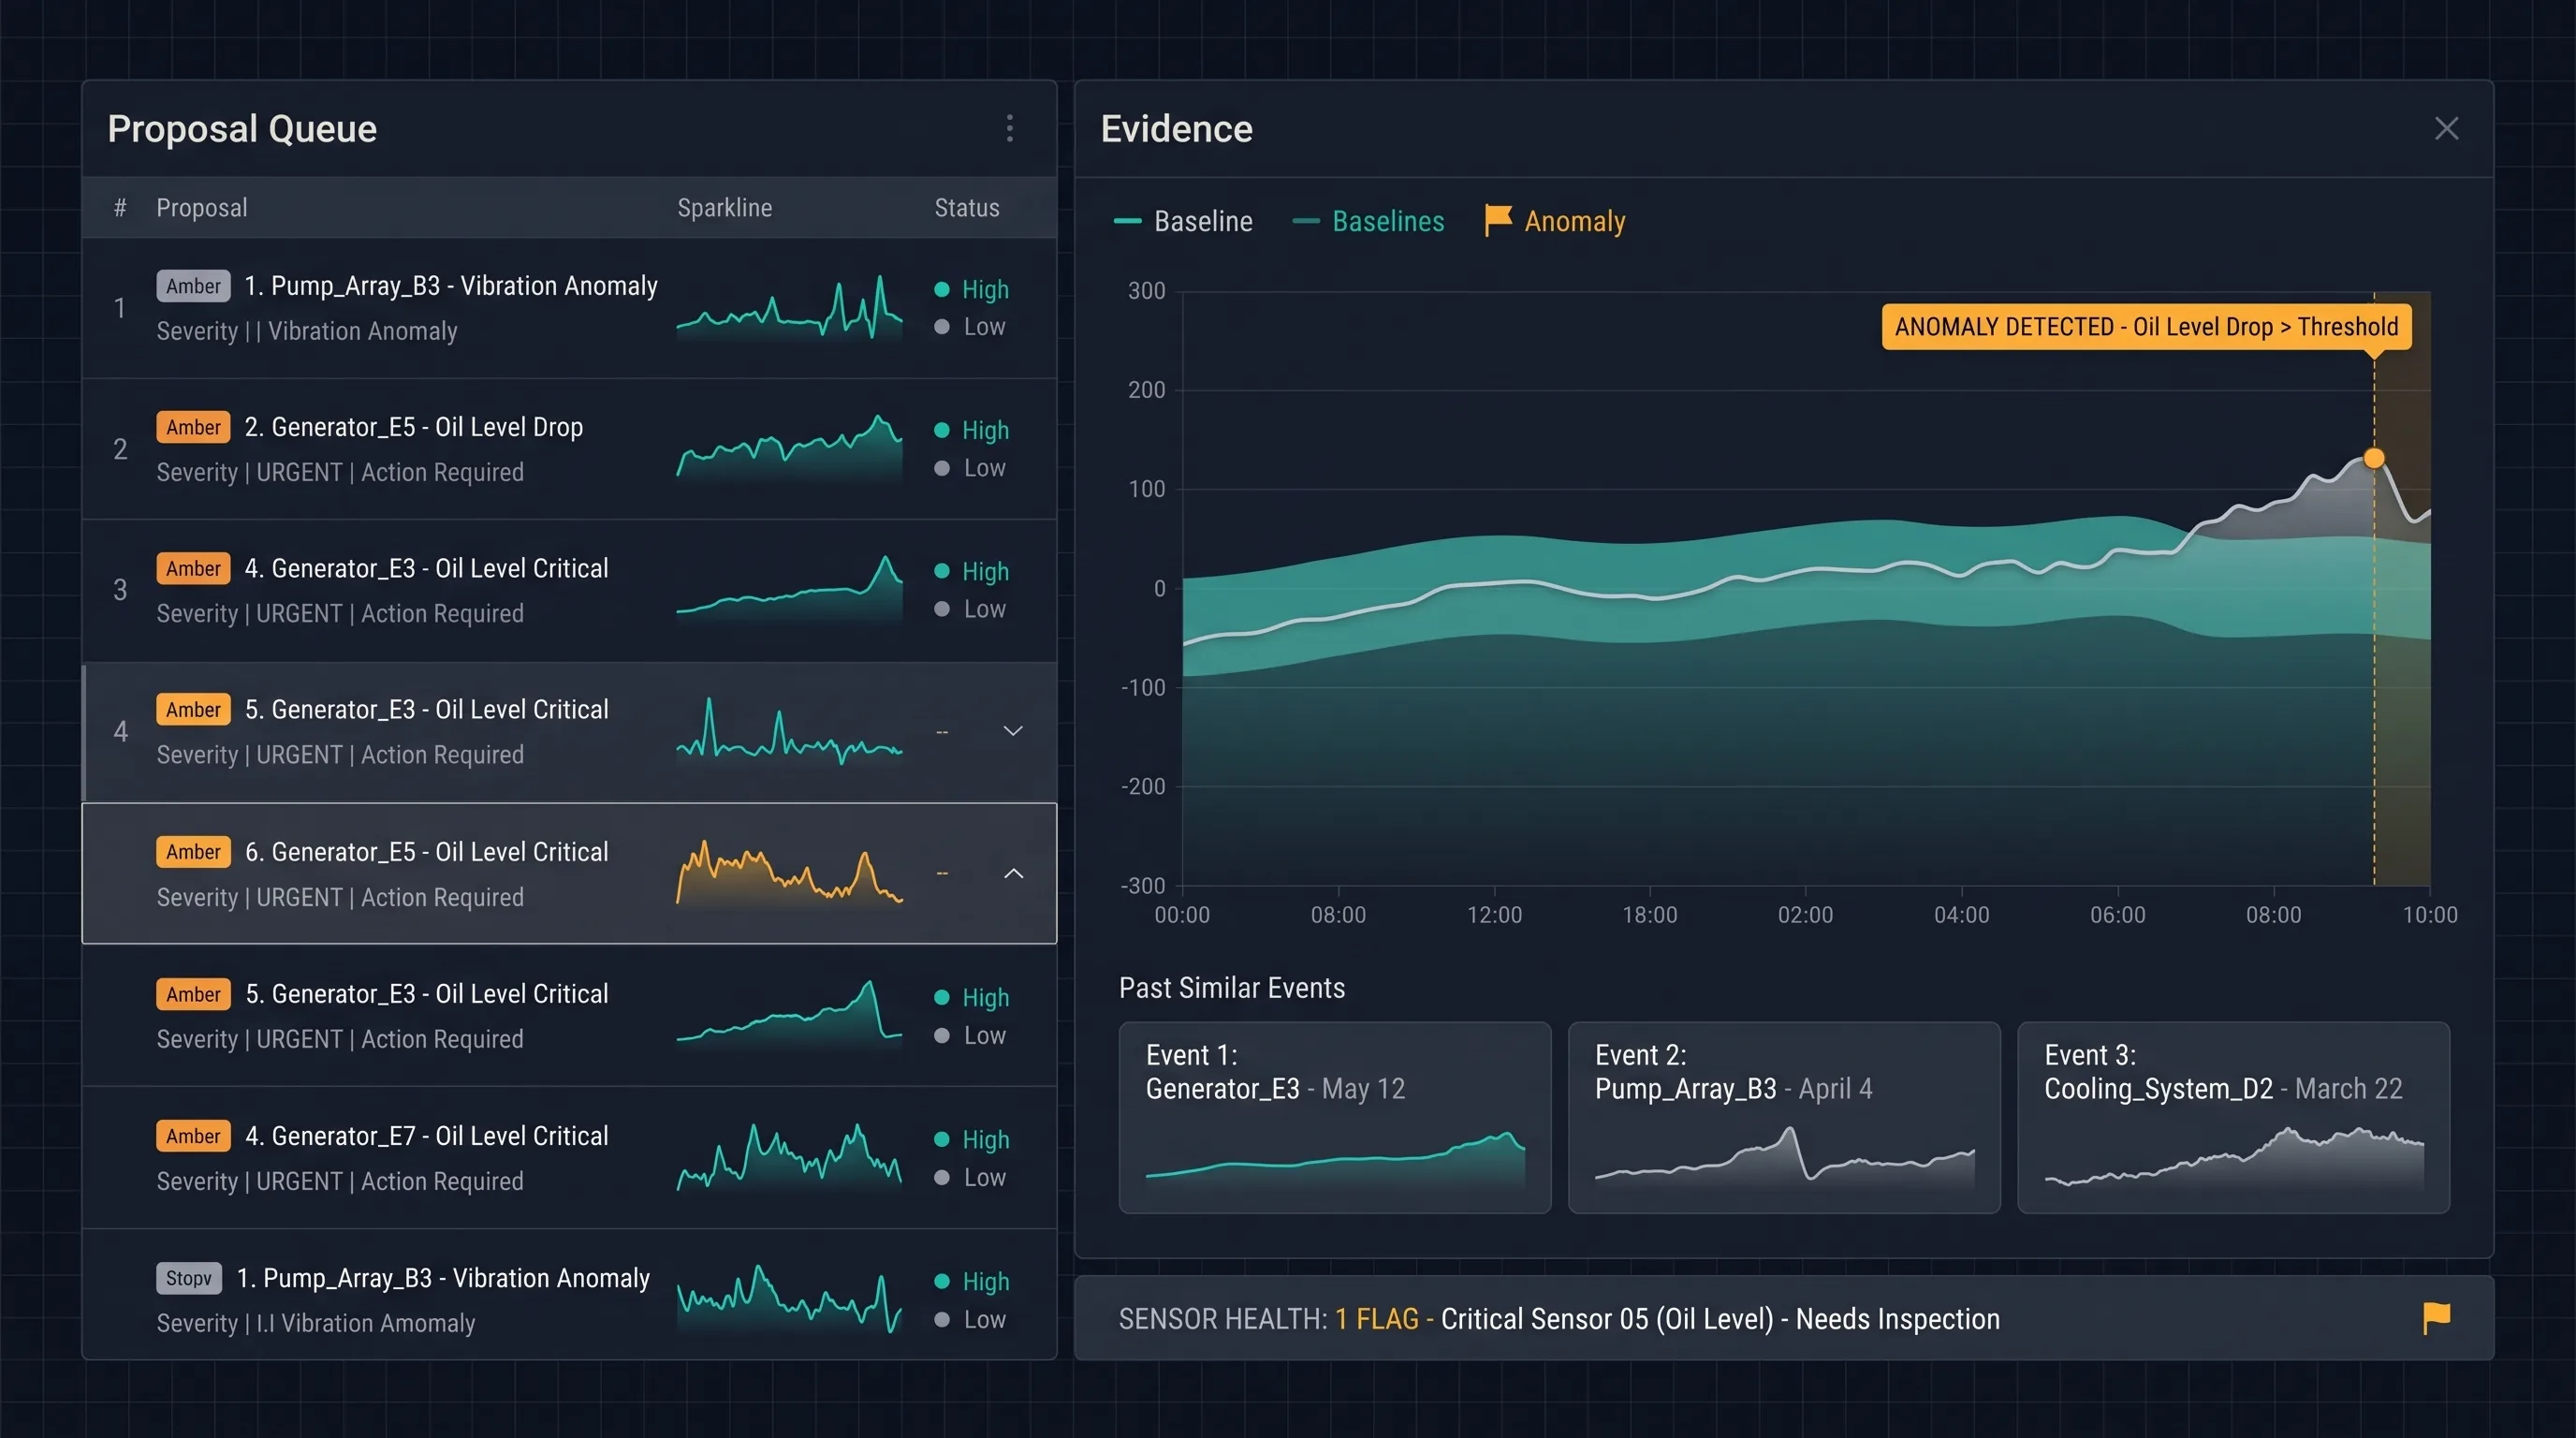
- Evidence over verdicts. Every proposal shows the signal trace, the asset’s own baseline behavior, and similar past events. A planner should be able to disagree with the model using the model’s own exhibits.
- Baseline honesty. The console continuously compares its proposals against naive threshold rules per asset class. Where a simple rule wins, the scorecard says so — and the simple rule runs.
Core planning loop
- Sensor data streams in quality-checked, gaps flagged
- Anomaly scoring against each asset's own baseline
- Proposal ranked in queue evidence panel attached
- Planner reviews schedule, defer, or dismiss with reason
- Technician executes mobile companion, findings captured
- Outcome logged feeds the models and the scorecard
Major features
- Asset health board: fleet-level view ordered by proposal severity and asset criticality
- Proposal queue with evidence panels — traces, baselines, similar historical events
- Alert budget and a public precision scorecard per asset class
- Dismissal reasons captured as structured labels, turning planner skepticism into training data instead of lost signal
- Sensor health monitoring: drift, dropout, and calibration flags beside the assets they compromise
- Work order handoff to the existing CMMS — the console plans, it does not replace
- Mobile companion for technicians: the proposal’s evidence at the asset, offline-tolerant findings capture, and a one-tap confirm-or-refute that closes the loop
Where AI fits — and its limits
Per-asset-class anomaly detection over time-series data is the core, with ranking tuned to the alert budget and retrieval over past events (“this pump looked like this before the seal went”). Remaining-useful-life estimates appear only as wide, honest intervals — never as a date, because a confident date would be fiction.
Out of the model’s hands: scheduling, shutdown decisions, anything safety-critical, and severity overrides on assets the site has marked critical. When input quality drops below the floor, the model says “cannot score — sensor 4 has been flat-lining since Tuesday” rather than producing a number anyway.
The baseline test
This concept’s evaluation philosophy deserves its own section, because it is the pitch. Most predictive maintenance value claims are measured against nothing. Here, evaluation runs against three explicit baselines: the site’s existing threshold alarms, a run-to-failure history replay, and the planner’s own calendar-based plan.
- Precision and recall on retrospectively labeled failure events, per asset class
- Lead time distribution: how much earlier than the threshold alarm, when earlier at all
- Planner acceptance rate of proposals, with dismissal-reason analysis
- An honest expectation stated up front: on some asset classes, threshold rules will win. The product’s job is to know which, and to show it.

System overview
- Ingestion: historian and OPC UA connectors with an edge buffer for unreliable links
- Time-series store plus an asset model that maps tags to physical equipment — the unglamorous mapping work that decides whether anything downstream is trustworthy
- Scoring pipelines per asset class; feedback store for dispositions and outcomes
- Web console for planning; offline-tolerant mobile companion for the floor
- CMMS integration for work orders in both directions
Prototype scope
One asset class — rotating equipment, pumps and fans — and no live plant at all to start. The prototype replays historical historian data and is judged retrospectively: on replayed history, can the pipeline flag known failures earlier than the site’s threshold alarms while staying inside a planner-set false-alert budget? Only a pipeline that survives replay earns a shadow-mode trial.
Risks and open questions
- Label scarcity: real failures are rare and half-documented; evaluation corpora will be small, and the statistics must be honest about that
- The trust ratchet: one bad week of false alarms can cost months of credibility — the alert budget is a design response, not a guarantee
- Data plumbing dominates: tag mapping and historian quirks will consume more effort than modeling, and the plan has to budget for that reality
- Feedback bias: dismissed proposals are never observed to completion, so the outcome data self-censors — the evaluation design needs to account for it
- Organizational adoption: a proposal queue can become one more ignored inbox; the planner’s existing weekly ritual is the integration target, not a new one
Delivery phases
- Data audit sprint: tags, historian coverage, maintenance log quality at a candidate site
- Replay prototype on one asset class, scored against all three baselines
- Shadow mode on live data — proposals generated and measured, not yet acted on
- Planner-in-the-loop pilot with the mobile companion and CMMS handoff
Expansion possibilities
Earned trust compounds: spare-parts demand planning from proposal patterns, energy-anomaly detection on the same ingestion spine, cross-site benchmarking for multi-plant operators. Each is a decision gated on the scorecard, not a roadmap default.